State of the Sport: USAC Racing in 2019 by the Numbers
Nearly twelve months ago we dove into USAC participation data to deliver what was the first of many State of the Sport entries focused on understanding the latest trends impacting bike racing. Now we have a look at the 2019 data - and the numbers are not good. Read on for the complete analysis and don’t miss our look at the state of gravel racing, details on local NYC race trends, and our breakdown of the lifecycle of the average bike racer (spoiler alert: it is shockingly short).
Note: all of these figures are pulled from USAC presentations though event categorization for those presentations was changed between 2018 and 2019, hence why we focus on 2006-2018 and 2019 vs 2018 trends separately. In addition, because 2019 year-to-date numbers run through September 20th, only a few weeks of fall events are included in the data - as a result, and taken in tandem with changes in the nationals calendar, the cyclocross year-over-year comparisons are not particularly relevant.
Participation Continues to Decline
When we looked at 2018 USAC data last fall, the participation trends year-to-date through early-September 2018 were modestly negative with competitive racer days down 7% and total racer days down 3%. Taken as standalone data points these numbers were not great, but also not exactly a huge surprise based on our experiences on the ground and organizing races for CRCA in New York City. The 2017/2018 comparisons highlight the decline in competitive racing:

Source: USAC’s 2018 Location Association YTD Presentation detailed here.

Source: USAC’s 2018 Location Association YTD Presentation detailed here.
What worried us about the 2018 data was less the modest declines compared to 2017 and more the significant multi-year decline that preceded. According to USAC’s data, between 2012 and 2017 total racer days declined from a peak of ~625,000 to just 450,000 in 2017. Assuming an average registration fee of $30 per event, this roughly 30% cumulative decline equates to more than $5 million of registration fees leaving the sport helping explain the death of so many races. In fact, the data shows 2017’s participation was by far the lowest level of race participation going back to at least 2006, the first year data was available. This decrease highlights just how much the sport has declined not just from its 2012 peak but also from the mid-2000’s:

The Rate of Decline in Participation is Getting Worse
Which brings us to the 2019 figures. While USAC changed their reporting methodology for this year, the latest figures show that the sport has only continued to shrink. In fact, in most regards it appears that the decline of the sport has accelerated significantly as year-to-date road participation has declined by a dramatic 11% in 2019, significantly worse than the 7% decline in competitive racer days reported at this time last year:

Source: USAC’s 2019 Location Association YTD presentation. 2018 figures are calculated based on disclosed % change.

Source: USAC’s 2019 Location Association YTD presentation.
As the table above shows, there are some modest bright spots with growth at the track and modest increases in mountain bike racing. The dramatic decline in CX is troubling at first glance, but this data ends on 9/20 so it only captures the first few weeks of 2019 CX season and is impacted by the shift in the nationals calendar. As a result we would warn against focusing on the 40% year-over-year decline that USAC is reporting - in fact we are going to dive into some preliminary East Coast CX data to in a separate journal entry. All that said, as the charts above highlight, road is by far the largest discipline for USAC so the 11% decline in year-to-date road racing, coming on the back of the aforementioned ~30% decline in the prior five years, underscores just how challenged the sport as a whole is at the moment.
Events are also in Decline
This brings us to a second, equally troubling data point: the number of events on the calendar only continues to almost universally shrink, including a nearly 5% decline in the number of road events in 2019 (data through September 20):

Source: USAC’s 2019 Location Association YTD presentation.

Source: USAC’s 2019 Location Association YTD presentation.
This decline probably doesn’t shock anyone who has read our Race Director Diaries: the simple fact is that organizing races continues to get more expensive. With significantly fewer participants than there were five years ago, balancing budgets has only gotten more difficult - see our detailed dive into the CRCA Bear Mountain Classic for one example. Unfortunately, 2019’s decline comes after a four year stretch where the number of USAC events declined significantly. As we wrote about last year, USAC events went from nearly 2,500 events in 2012 to just 1,800 event in 2017 (USAC appears to have changed their reporting methodology so that 2019 data isn’t comparable to the multi-year dataset in last year’s Journal entry):

There is certainly a chicken vs. the egg debate to what is more important - events versus participation. But with fewer and fewer races it seems safe to assume that, particularly in regions with sparse race calendars, for some riders there is less and less logic to even consider a USA Cycling license, which in turn fuels lower participation numbers.
Events by Region
Unlike last year, USAC did not disclose 2019 membership numbers by region. Instead they provided event count by region, splitting up the data by Local Association (for reference: some states like California have multiple Local Associations, others Local Associations like NEBRA cover multiple states). As you might expect from all of the numbers above, the regional data is not great with 21 of the 34 Local Associations reporting a decline in events. Montana shows the greatest decline at more than 50% but for Local Associations that lost events the mean and median declines were a very high 15.8% and 11.5%, respectively.
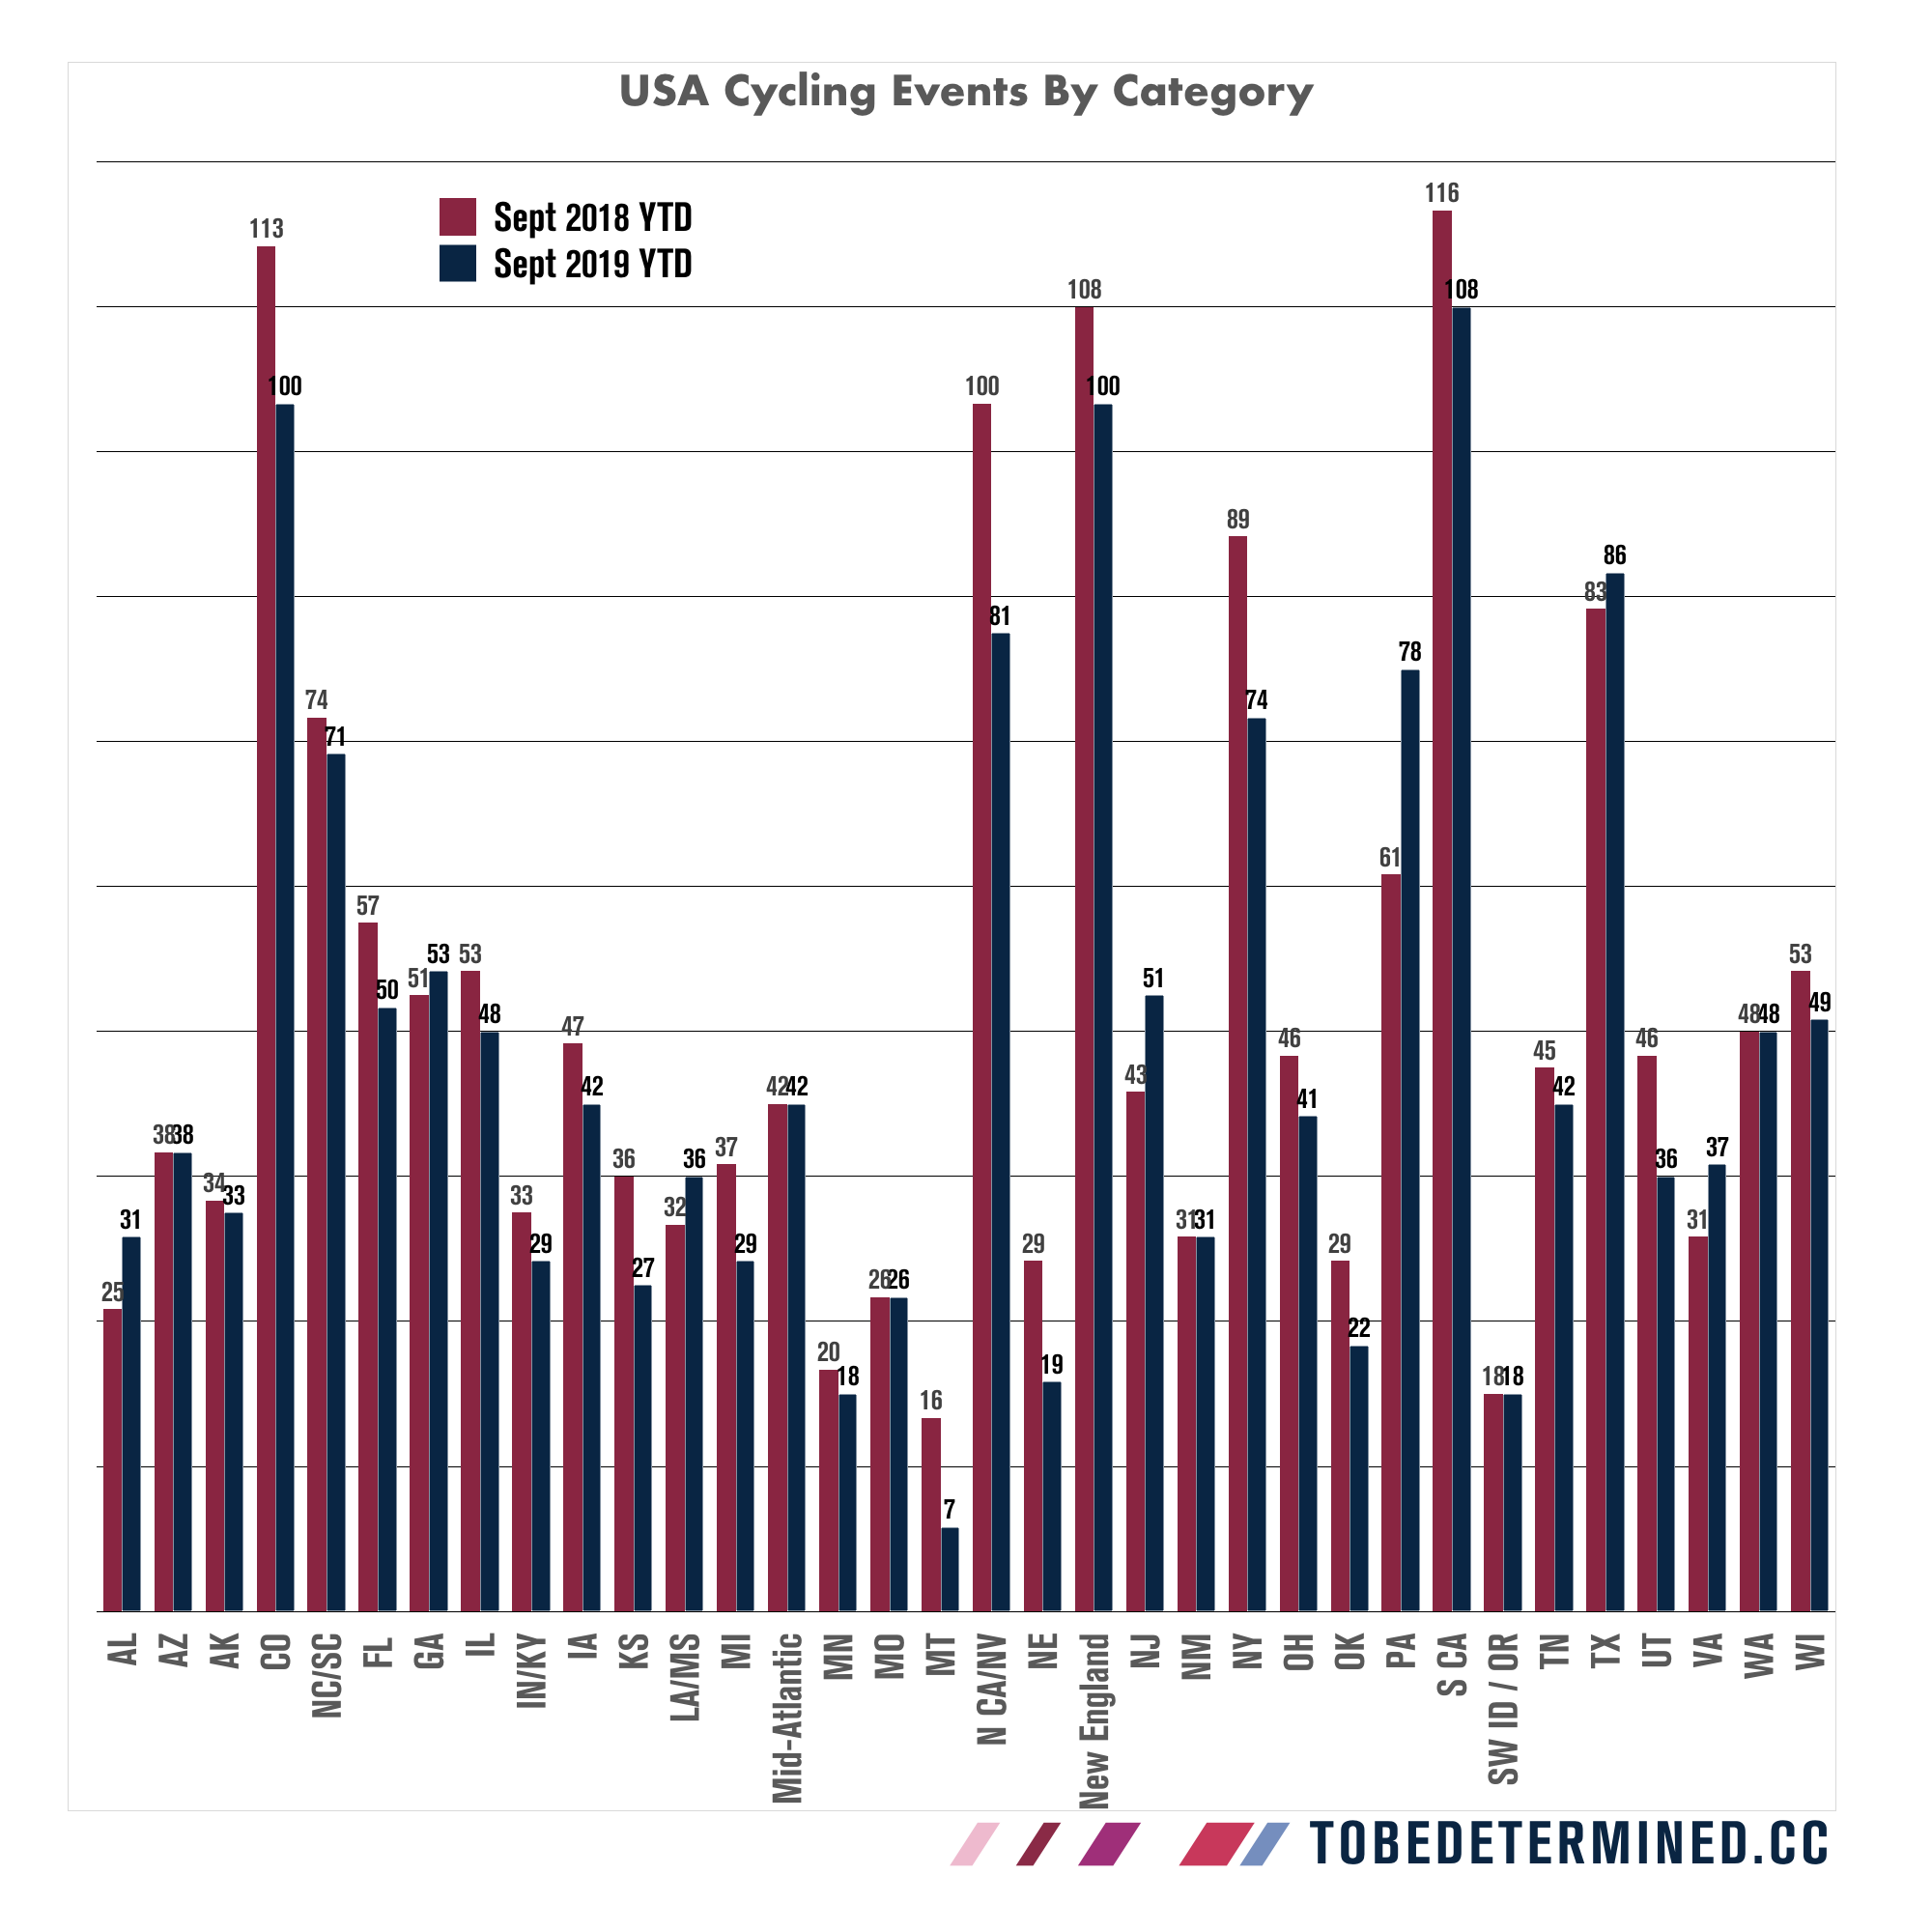
Source: USAC’s 2019 Location Association YTD presentation.

Source: USAC’s 2019 Location Association YTD presentation.
What does it all mean?
We’re going to save a deep qualitative dive for another Journal entry, but needless to say the 2019 data doesn’t look good for traditional USAC racing. Participation and event days are both going to be negative this year, but with the former shrinking faster than the latter we worry that the race calendar will only continue to condense further next year — especially as USAC is already talking about a 20% increase in insurance premiums. If event costs continue to increase at the same time that participation continues to decline, a smaller race calendar unfortunately feels almost inevitable. Against this backdrop, USAC has established the following goals for 2020:
• Slight increase in events as whole as compared to 2019
• Increase in MTB, Track, Gravel and Gran Fondo’s
• Flat in CX
• Slight decrease in competitive Road for 2020
Hopefully that first bullet point - a slight increase in events - comes to fruition as USAC needs some way to stop the negative feedback loop of declining participation leading to fewer events which leads to fewer USAC members and thus still lower participation. But even so, in the final bullet point USAC seems to be acknowledging that road racing is likely to continue to shrink in 2020, a fact that doesn’t bode well for riders (and race directors) focused on traditional USAC racing.
Is there a floor at which point the sport can stabilize at healthier levels for racers and race directors alike? The accelerating decline in 2019 numbers suggests that we’re not yet at that inflection point, but with a host of new leadership walking in the door at USA Cycling it will be interesting to see what initiatives they put on the table, not just to stabilize USA Cycling membership with their newfound focus on recreational riders, but hopefully to help traditional categorized racing reach a stable equilibrium. In the interim, for those of us that know and love traditional USAC category racing, the time is now to put our heads together to try to work through some solutions to stabilize the sport.
More to come soon….


Our State of the Sport Series returns with analysis of registration for the Pennsylvania CX Series